in last 10 minutes
Changes between NaviServer 4.99.4 and 4.99.5
Changes between NaviServer 4.99.4 and 4.99.5
<neumann@wu-wien.ac.at>February 2013
1. New Request Dispatch Architecture
The request dispatch on NaviServer 4.99.4 (and the AOLserver family) works via (a) adding an incoming request into a queue and (b) send send a signal to an unknown number of connection threads of a pool which are assumed to wait for this condition. If there are multiple connection threads waiting for the conditions, the thread which is waked up is determined by the Operating System. Usually, this leads to a round-robin behavior. As a consequence, the thread idle timeout is pretty useless on somewhat busy sites (when request come in at a rate where each thread is waked up before threadtimeout). Furthermore threads terminating based on the connection count die more or less at the same time leading to a "mass extinction". To address this problem, the stochastic spread factor was introduced.
The new dispatch mechanism is maintaining the list of idle connection threads per pool. and can therefor control the dispatch explicitly. The implemented policy assigns the jobs in a LIFO manner to the connection threads. When there are several threads available, the requests are not evenly distributed, the least used thread (at the end of the LIFO queue) can properly time-out. The likelihood of the "mass extinction" is greatly reduced. The spread factor is not needed and has been removed.
In the new architecture, jobs can be directly assigned to threads and the single thread is activated with a signal. The job queue is just used for cases where no idle connection thread is available. The new implementation uses separate locks for waiting queue (wqueue) and thread queue (tqueue) per pool. The changes lead to significant finer lock granularity and improve scalability.
I have tested this new version with a synthetic load of 120 requests per seconds, some slower requests and some faster ones. This load keeps about 20 connection threads quite busy on my home machine. The contention on the new locks is very little: on this test we saw 12 busy locks on 217.000 locks on the waiting queue, and 9 busy locks out of 83.000 locks on the thread queue. These measures are much better than in NaviServer 4.99.4, which has on the same test on the queue 248.000 locks with 190 busy ones. The total waiting time for locks is reduced by a factor of 10. One has to add, that it was not so bad before either. The benefit will be larger when more threads and maybe multiple pools are used.
The new version implements connection thread scaling via the number of
entries in the connection queue. The term connection thread scaling
refers to automatically create additional connection threads between
the minimal and the maximal number of threads (minthreads and
maxthreads). Connection thread scaling is useful when a site master
does not know how many connection threads should be created to keep up
with the expected load. This is increasingly important when the load
varies over time. In general, the server is allowed to grow up to
maxthreads connection threads and can shrink again the number of
threads vis the idle timeout or the number of jobs per connection
thread. in practice, newer web applications tend to have today higher
number of embedded resources than a few years ago. When a page
contains e.g. 50 embedded resources to be requested from the same web
server (e.g. css, js, images), current browser open several pipelines
in parallel to the server (the default for firefox are 6 persistent
connections). The arriving requests are parsed and dispatched to the
available connection threads. For high number of embedded resources it
is quite likely that some requests are queued. When requests are
queued this is a good sign that maybe more connection threads should
be created. The server uses to parameters to control this behavior
which are defined as percentage of the queue size.
-
lowwatermark: if the actual queue size is below this value, don’t try to create threads; default 10% -
highwatermark: if the actual queue size is above this value, allow parallel thread creates; default 80%
When lowwatermark is set to 0, this means that every queue operation
might create a new threads. The variable highwatermark controls
concurrent thread requests, which can cause problems when certain
c-level extensions are used in the C code. Setting these value 100
turns this feature off. Both parameters control the aggressiveness (or
willingness) of the server to create additional connection threads.
2. Request Queueing and Latencies
Although not directly related with the new request dispatch mechanism, the new implementation was a good opportunity to look closer on request latencies. Frist a small example from a real world website to clarify the problem (most synthetic benchmarks would not show this).
Consider a server with two running connection threads receives 6 requests, where requests 2-5 are received in a very short time. The first three requests are directly assign to connection threads, have fromQueue == 0. These have queuing times between 88 and 110 micro seconds, which includes signal sending/receiving, thread change, and initial setup in the connection thread. The runtimes for these requests are pretty bad, in the range of 0.24 to 3.8 seconds elapsed time.
[1] waiting 0 current 2 idle 1 ncons 999 fromQueue 0 queue 0.000110 run 0.637781 total 0.637891
[2] waiting 3 current 2 idle 0 ncons 998 fromQueue 0 queue 0.000090 run 0.245030 total 0.245120
[3] waiting 2 current 2 idle 0 ncons 987 fromQueue 0 queue 0.000088 run 0.432421 total 0.432509
[4] waiting 1 current 2 idle 0 ncons 997 fromQueue 1 queue 0.244246 run 0.249208 total 0.493454
[5] waiting 0 current 2 idle 0 ncons 986 fromQueue 1 queue 0.431545 run 3.713331 total 4.144876
[6] waiting 0 current 2 idle 0 ncons 996 fromQueue 1 queue 0.480382 run 3.799818 total 4.280200
Requests [4, 5, 6] are queued, and have queuing times between 0.2 and 0.5 seconds. The queuing times are pretty much the runtimes of [2, 3, 4], therefore the runtime determines the queuing time. For example, the totalTime of request [4] was 0.493454 secs, half of the time it was waiting in the queue. Request [4] can consider itself happy that it was not scheduled after [5] or [6], where its totalTime would have been likely in the range of 4 secs (10 times slower). Low waiting times are essential for good performance.
This example shows pretty well the importance of async delivery mechanisms like the writer thread or bgdelivery in OpenACS. A file being delivered by the connection thread over a slow internet connection might block later requests substantially (as in the cases above).
At the same time the example shows the importance of async receive
operations, since when these packages are handled in a connection
thread, the blocking time of the connection thread will be larger as
well. NaviServer distinguishes between asynchronous and
synchronous drivers, where e.g. nssock is defined synchronous and
nsssl is defined asynchronous. For asynchronous drivers, the
receiving of the request and the parsing of the request happens in the
driver, where for synchronous drivers (which might block on read or
write operations), the driver just accepts the request and delegates
all further work into the connection threads, leading to higher latencies.
The analysis of the latencies lead to several extensions in the new version of NaviServer, which are described in the sequel.
2.1. Fine Grained Time Introspection
NaviServer 4.99.4 as very little introspection facilities for timing measurements, which consists essentially of the start time of a request, which is actually the time a request is put into a queue.
The new version tracks internally the following time stamps:
-
accept time stamp
-
queueing time stamp
-
dequeuing time stamp
-
filter done time stamp (after preauth and/or postauth filter)
Based on these time stamps, one can determine e.g. the queuing duration (which was shown already above), or one can measure the duration of NaviServer filters or the pure runtime. From these times, the accept time is the least interesting for performance tuning, since the accept might have happened already at some earlier time in an persistent connection. The queuing time is very important for analyzing latencies and can be influenced by the server settings. Often, just the pure runtime is what might me optimized by a user of a framework like OpenACS.
Furthermore, most web-servers have the problem that analyzing the access log is often problematic since the access log is (a) sorted by the request end-times and (b) the time granularity of one second is rather crude.
The new version of NaviServer allows to track optionally the partial
times together with a high resolution time stamp (micro second
resolution) in the access log. This can be achieved by setting
logpartialtimes in the nslog parameter section to true. In
addition, the new NaviServer version tracks the aggregated times
and makes these available via ns_server stats. This
command returns an attribute value list containing the aggregated
durations, but as well the aggregated number of spool operations, the
number of requests, the number of queued requests, and the number of
connection threads created. All these values are measured since the
start of the server.
% ns_server stats
requests 51 spools 4 queued 0 connthreads 5 accepttime 4.270051 queuetime 0.006188 filtertime 2.259168 runtime 1.191496
The command ns_server stats can be used to monitor the system
response behavior. The graphic below shows the development of the
website next-scripting.org which uses the new NaviServer version in
various development states.
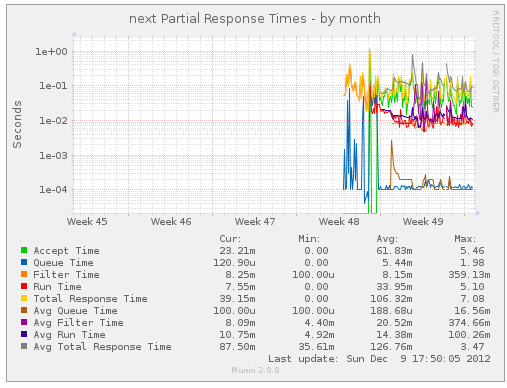
The blue line is showing the queuing time which was at the beginning often in the 0.1 seconds range. The reported values are the averages taken from a 5 minutes interval. By improving various factors (which will be addressed below), the current values are in the range of hundred microseconds. One can see as well the tendency, how the total response time decreased (although this is shown on an exponential y scale).
Another new feature is the ability to link NaviServer threads to the
OS-specific IDs. This (currently Linux only feature) allows to query
the operating system for several informations about a thread. One can
for example query the user and system time used per thread. The
OS-specific IDs are returned as last entry in ns_info threads. If
there is no OS support available, the value 0 is used as a place holder.
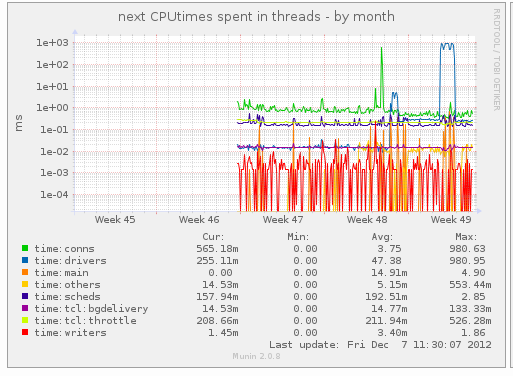
The chart below shows what amount of CPU time is used by a web site
for what kind of NaviServer thread. We can see here, how e.g. the
driver thread nssock looped due to a bug during development (while
the server was fully functioning).
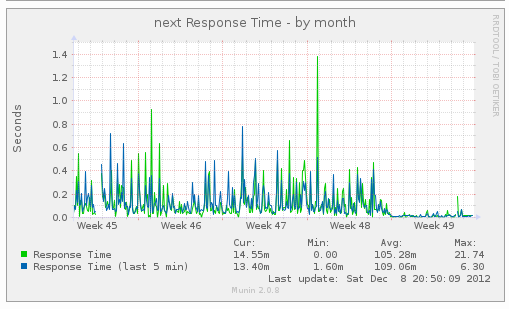
The next graph shows the total response times of the server on a metric scale. Notice, how the perceived response time was reduced in week 49, where the asynchronous SSL driver was introduced. The traffic patterns were very similar in weeks 45 to 49, around 4,000 request per day from 40 to 60 visitors.
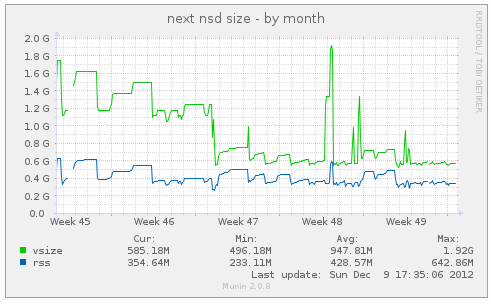
The last chart displays the memory consumption over the test
period. At the begin of week 47, we switched from Tcl’s default malloc
(zippy malloc) to TCMalloc (the change requires a modification of the
Tcl sources). At the end of week 46, we restricted the number
of connection threads to 2 (parameter minthreads and maxthreads to
2). In the begin of week 47 we set minthreads to 5 and maxthreads
to 10 and switched to TCMalloc. The peaks in week 48 are short runs of
the server without TCMalloc.
For more information about different mallocs in multithreaded Tcl applications, see https://next-scripting.org/xowiki/docs/misc/thread-mallocs
2.2. Reduce Latencies
When we started to analyze a day’s traffic on next-scripting.org, we
used the previous (synchronous) version of nsssl. For synchronous
drivers, the accept time is always zero. By analyzing the traffic of
the day, the queue time was on average 54 ms (milliseconds), which is
huge, while the median is 0.1 ms. The reason is that we can see a
maximum queue time of 21 secs! As a consequence, the standard
deviation is as well huge. When one looks more closely to the log
file, one can see that at times, when the queuing time is huge, as
well the runtime is often huge, leading to cascading effects as
described above.
        accept  queue   run     total
avg     0.0000  0.0547  0.2656  0.3203
stdev   0.0000  0.7481  0.9740  1,4681
min     0.0000  0.0000  0.0134  0.0135
max     0.0000  21.9594 16.6905 29.1668
median  0.0000  0.0001  0.0329  0.0330
The causes for the "random" slow cases are at least from two sources:
slow network connections (some clients are slow in retrieving data,
especially some bots seems to be bad) and system specific latencies
(e.g. backup running, other servers becoming active, etc.). To address
the problem with the slow network connection, i moved first more file
deliveries to the writer thread (reducing writersize) and activated
TCP_DEFER_ACCEPT. By taking these two measures, one can observer nice
improvements: the average queuing time for a day is now 4.6 ms, but
still the standard deviation is huge, caused by some "erratic" large
values.
        accept  queue   run     total
avg     0.0000  0.0046  0.1538  0.1583
stdev   0.0000  0.0934  0.6868  0.6967
min     0.0000  0.0000  0.0137  0.0138
max     0.0000  4.6041  22.4101 22.4102
median  0.0000  0.0001  0.0216  0.0217
A typical source for system specific latencies is the file system. When the latency for writing an entry to a log files (e.g. access log or error log) is high, the thread performing is operation will be blocked for this time. At earlier times we observed on a different website write latencies in the seconds range caused by ext3. This site is much better in this regard, but we see there as well maximum latencies in the range of 200 ms (which is actually an acceptable value).
To address the problem, i have implemented asynchronous writer thread for log files. This causes logging operations from connection threads to be faster and independent from the write latencies of the operating system. The table below shows again a full day with the Async-Writer thread on the same site. The avg queueing time dropped from 0.0547 to 0.0009, the standard deviation from 0.7481 to 0.0211. This is a noticeable improvement.
        accept  queue   run     total
avg     0.0000  0.0009  0.1304  0.1313
stdev   0.0000  0.0211  0.9022  0.9027
min     0.0000  0.0000  0.0032  0.0033
max     0.0000  0.9772  28,1699 28,1700
median  0.0000  0.0001  0.0208  0.0209
But still, the sometime large values are worth to investigate. It
turned out that the large queueing above time came from requests from
a site with a probably bad internet connection (Taipeh), where for an
error message the writer thread was not used. Funny enough, the log
file analysis showed that the delivery of the error message blocked
the connection thread longer than the delivery of an larger image. The
reason for this is that the image had a size abover the writersize
and was therefore using the background writer.. It turns out that
allowing deliveries of error messages over the writer thread requires
some refacturing of the infrastructure, which i have not done.
The problem in such cases is not only delivery of the files, but as well latencies caused for incoming packages by the sync driver. When a synchronous driver is used, all receive operations for the incoming request block the connection thread.
Therefore the next logic step to address the problem is to make
nsssl asynchronous. Below is again the analysis of a full day of
next-scripting.org with the asynchronous implementation of nsssl.
The average queue time is lower by again a factor of 4, the standard
deviation is as well much better.
        accept  queue   run     total
avg     0.0599  0.0002  0.0183  0.0196
stdev   0.3382  0.0039  0.0413  0.0530
min     0.0000  0.0001  0.0011  0.0012
max     12,1002 0.2324  0.8958  2,0112
median  0.0088  0.0001  0.0118  0.0120
After running the server a few days, we observed still some unexplained slow calls. While in the day below, the figures for queue are even better as for the day above (see e.g. stdev), a few requests took quite long.
        accept  queue   run     total
avg     0,1463  0,0001  0,0355  0,0429
stdev   1,0841  0,0003  0,6566  0,6567
min     0,0000  0,0000  0,0010  0,0012
max     31,6194 0,0066  30,2704 30,2798
median  0,0082  0,0001  0,0026  0,0117
Some digging revealed, that this were requests for a mobile user with
a bad bandwidth. The delivery time for an adp page counts as
"runtime". Therefore a slow delivery could still block a connection
thread. The writer threads where implemented in NaviServer 4.99.4 just
for file deliveries (and the manual invocations via ns_writer).
A dependency of the servers availability on on the client connection
speed is a serious problem it this opens a vulerability for DOS
attackers minicking slow connections. This was a further motivationto
implement as well asynchronous delivery for adp pages (and all other
dynamic content) and as well for streaming HTML output (sent e.g. via
multiple ns_write operations) when enabled.
2.3. Asynchronous Architecture
Below are three Figures to show the differences between older versions of NaviServer (and AOLServer) and NaviServer 4.99.5.
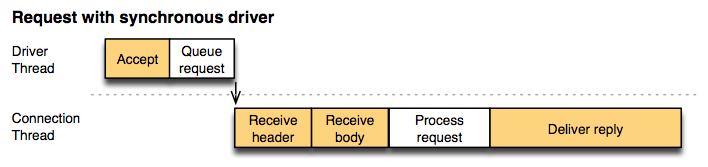
The simplest case it the architecture with a synchronous driver
(Figure 5), which was used e.g. in
NaviServer 4.99.4 and before for connections over nsssl. In this
case, the driver thread is just responsible for handling the incoming
request (accept) and for handing it over to the connection thread. The
connection thread is responsible for receiving the request, processing
the request (computing the results) and delivering the content to the
client. Once the connection is established the connection thread is
handling all IO operations, which can be blocking IO, since the
blocking affects only the single thread. The yellow background denotes
spooling activities, which are activities involving receiving and
sending TCP packages from and to the client. While the CPU
requirements for spooling is very little, the elapsed time of these
operations are hard to predict and depend on external factors.
in this case a connection thread is occupied in this case for a long time which is hard to predict. Since the connection threads are a scarce ressource, the scalability of the server is limited. The connection threads require much more resources since they are are responsible for the heavy-computations (in OpenACS often several thousands of procs/objects/classes); therefore they require much resources and are available only in small quantities.
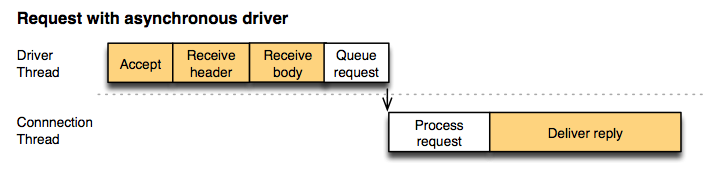
When an asynchronous driver (Figure 6) is used (e.g. nssock under NaviServer
4.99.4, or nssock and nsssl under 4.99.5) the driver is
responsible for the full receipt of the HTTP request. Fot this kind of
architecture, the driver has to support asynchronous (non-blocking) IO
for receiving the request. Since the CPU effort for handling every
incoming packet is little, a single driver is able to handle multiple
receive operatons at the same time. The big advantage of the server
with the asynchronous driver is that the time spent in the connection
thread is significantly reduced. By reducing the elapsed time span in
the connection threads, the server is able to improve throughput and
to reduce latencies (see above).
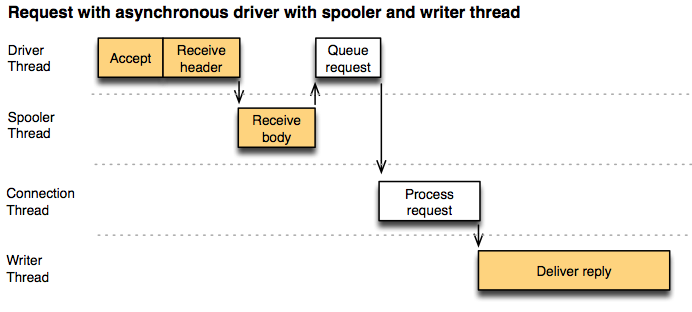
NaviServer 4.99.5 favors the model of Figure 7, where the elapsed time-span in the
connection thread is reduced further by delegating the output spooling
the one or more writer threads. One writer thread is able to handle a
high number of simultaneous output spooling tasks. 4.99.4 supported
just a limited forms of writer deliveries (file-deliveries with open
fd handles and string deliveries, no partial write support in writer
thread, every block-write operation blocked a writer thread) where
4.99.5 supports as well ADP-deliveries, HTML streaming deliveries (via
ns_write), and mmapped deliveries with full asynchronous output
handling in the writer threads.
Optionally a spooler thread can be used to take some load from the driver when many uploads are performed, but this has typically little influence on the latencies. The spooler threads are identical to 4.99.4.
By delegating the various processing steps to multiple threads, NaviServer 4.99.5 is able to benefit much better from multi-core architectures and improves throughput via pipelining and using asynchronous IO-Operations for spooling activities. Depending on the needs, the server can be configured to use multiple (lightweight) spooler and writer threads.
3. Summary of Improvements
-
New Dispatch Architecture
-
lower latency, better scaling
-
-
Latency Related Improvements:
-
asynchronous nsssl driver
-
asynchronous log writer
-
asynchronous delivery of dynamic content (e.g. adp pages)
-
-
Improved writer thread support (managing async content delivery):
-
New command
ns_conn clientdatato be handed tons_writer listto establish connection between requests and listed active writer sessions -
More detailed output in
ns_writer list, e.g. containing starttime, threadname and client data -
Handling of HTML streaming output via writer threads (activated via configuration paramater
writerstreaming) -
New commands
ns_writer size /driver/ ?value?andns_writer streaming /driver/ ?value?to query/change writer configuration values at runtime. -
various fixes (added explicit eof-handling to avoid busy event loops, thread-safety of introspection, memory management)
-
when
ns_writer submitorns_writer submitfileis used, send content via writer regardless of the content size
-
-
Improved timing introspection
-
Compute partial times (accept time, queue time, filter time, run time)
-
Track partial times in accesslog together with high-resolution timestamps for determining the request order (the entries in the access log of the server are traditionally in the order of termination on a second granularity, which is often too coarse).
-
Determine OS level thread-ids if possible (Linux only) and report it via
ns_info threads. This can be used e.g. by a monitor (likensstats.tcl) to list user-time and system-time per thead. -
New subcommand
ns_server statsto return aggregated statistics from the server.
-
-
Added handling for deprecated tcl commands:
-
ns_deprecatedcan be used for procs which are deprecated. -
Ns_LogDeprecated()can be used in C-implemented commands
-
-
Reform of
ns_info/ns_server: Previously,ns_inforeturned various information from the "main" server of the nsd process, but there was no interface to obtain this information from an second (e.g. virtual) server or from a connection pool (every server might have multiple pools). These commands were moved tons_serverand the previousns_infocommands were marked deprecated. Also, passing optionally the (sometimes ignored) pool as second argument was deprecated in favor of an explicit -pool option.-
Server-specific commands (accept option -server)
ns_server ?-server server? filters ns_server ?-server server? pagedir ns_server ?-server server? pools ns_server ?-server server? requestprocs ns_server ?-server server? tcllib ns_server ?-server server? traces ns_server ?-server server? url2file -
Pool-specific commands (accept -server and -pool)
ns_server ?-server server? ?-pool pool? active ns_server ?-server server? ?-pool pool? all ns_server ?-server server? ?-pool pool? queued ns_server ?-server server? ?-pool pool? connections ns_server ?-server server? ?-pool pool? stats ns_server ?-server server? ?-pool pool? threads ns_server ?-server server? ?-pool pool? waiting -
New command
ns_server ?-server s? serverdirto return the base directory of the virtual server -
New commands to change some configuration parameters at runtime
-
New command
ns_server ?-server s? ?-pool p? minthreadsto query or set minthreads from the specified server and pool. -
New command
ns_server ?-server s? ?-pool p? maxthreadsto query or set maxthreads from the specified server and pool.
-
-
Marked several
ns_info/ns_servercommands as deprecated:ns_info filters ns_info pagedir ns_info pageroot ns_info platform (use $::tcl_platform(platform)) ns_info requestprocs ns_info tcllib ns_info traces ns_info url2file ns_info winnt (use $::tcl_platform(platform)) ns_server ?-server server? pageroot ns_server keepalive ?pool? (use "ns_conn keepalive" instead) ns_register_adptag (use instead ns_adp_registerscript) ns_adp_registertag (use instead ns_adp_registeradp)
-
-
TCP improvements:
-
support for deferaccept in nsssl
-
support for SO_ACCEPTFILTER on FreeBSD (nssock and nsssl)
-
support for TCP_NODELAY
-
support for TCP_CORK
-
support for TCP_FASTOPEN (requires Linux 3.7)
-
-
Security improvements for the SSL Driver:
-
Previous versions of
nssslcould be attacked via several measures. In particular the server could be attacked via the BEAST and CRIME attacks, it was as well endangered via client-initiated renegotiation which is an attack point for DoS. Part of the problem could be fixed via different configuration values. With the new code and the provided recommendation,nssslreturns better results than e.g. current nginx.
-
-
Misc Improvements:
-
New commands:
-
New command
ns_conn zipacceptedto query, whether the client accepts gzip-compressed content. This eases Tcl-level handling of such cases. -
New command
ns_fastpath_cache_statsobtain usage info from the fastpath cache.
-
-
Improved performance:
-
Sigificanly reduced number of lock operations: the previously most called mutex
nsd:confis practically eliminated -
Optimization of branches of most busy code pieces based on coverage analysis data
-
-
Easier debugging and development:
-
Allowing to call "nsd -c" without config file.
-
-
Bug-fixes and documentation cleanups:
-
Bug-fix for rolling access log when rollfmt is specified. Previously the log file was closed but not reopened, log data was lost.
-
Fixed all known range request bugs from regression test.
-
Fixed potential crashes in news c-libraries, which return frequently NULL
-
Improved default configuration (using e.g. connsperthread 10000)
-
Various documentation improvements and code cleanups
-
-
4. Configuration of the New Features
4.1. Logging of Partial Times
To add logging of partial times in the access log, set
logpartialtimes in the nslog section to true. Per default this feature
is turned off.
ns_section ns/server/${server}/module/nslog
        ....
        ns_param    logpartialtimes     true    ;# false, include high resolution start time
                                                ;# and partial request durations (accept, queue, filter, run)
        ....
4.2. Asynchronous Logfile Writer
To activate the asynchronous logfile writer, set asynclogwriter to true. Per default this feature is turned off.
ns_section ns/parameters
        ....
        ns_param        asynclogwriter          true            ;# default: false
        ....
4.3. Non-blocking SSL Driver
The new version of the SSL driver nsssl is implemented
asynchronously. The driver has as an additional new feature the
ability to use the TCP performance option TCP_DEFER_ACCEPT, which is
per default turned off. When defer accept is activated, the handshake
is simplified and the accept function is only called at the time when
data arrives.
ns_section ns/server/${server}/module/nsssl
       ....
       ns_param      deferaccept                true            ;# default false
       ....
Note that TCP_DEFER_ACCEPT is available in linux, bot not on all
platforms. FreeBSD has a similar mechanism called an acceptfilter. If
the the server is compiled on a platform where SO_ACCEPTFILTER is
available, this will be used when deferaccept is activated.
The SO_ACCEPTFILTER change was also implemented for nssock.
4.4. Streaming HTML output via writer
The server can now stream HTML output optionally via the writer thread. When sending server responses over slow connections, this option reduces the blocking time of the connection threads and can therfore reduce the damage of slow-read attacks.
ns_section ns/server/${server}/module/nssock
           ...
           ns_param   writerstreaming   true    ;# default: alse
           ...